This tutorial describes a method for monitoring floods using SCP and the freely available images acquired by MODIS and Sentinel-2.
Several services provide global monitoring of floods. For instance, the near real-time Global Flood Mapping provided by the NASA Goddard’s Office of Applied Science. This services apply a water detection algorithm to MODIS images, as described at this link . You can find an example of produced map here .
Of course, the educational purpose of this tutorial is to monitor flooded areas in a semi-automatic way, exploiting the characteristics of satellite images that can be downloaded with SCP. In particular, MODIS Products allow for the daily monitoring of floods, and the other satellite images (Landsat, Sentinel-2, and ASTER) have higher spatial resolution allowing for more local studies.
In this tutorial we are going to study the severe flooding occurred in the Ganges in August 2016, caused by monsoon rains. For more details, please read this informative page by NASA Earth Observatory.

Following the video of this tutorial.
1. Preprocessing settings
Start a new QGIS project. Before the download of satellite images, it is convenient to define the preprocessing options and calculations that will be applied automatically to downloaded images (read this tutorial From Image Download to NDVI Calculation in One Move ). We are going to calculate a water mask based on NDVI (Normalized Difference Vegetation Index). In fact, water has generally negative NDVI values, therefore we are going to set an NDVI threshold to create a water mask (there are also other spectral indices related to water identification, but for simplicity NDVI is used in this tutorial).Open the tab Band set clicking the button
 in the SCP menu, or the SCP Tools, or the SCP dock. Check
  Band calc expression, which is the link to the tool Band calc.
Band set settings
 Band calc, and enter the following conditional expression:
where( (( "#NIR#" - "#RED#" ) / ( "#NIR#" + "#RED#" )) < 0, 1, 0) @NDVI
NDVI after @ is the name of the output raster.TIP : after@use the variable#BANDSET#to automatically set an output name based on the name of the first band in the Band set

Band calc expression
2. Daily Monitoring With MODIS Data
We can now search the images. In this tutorial, we are monitoring a flood occurred in the Ganges river in August 2016.Open the tab Download images clicking the button
TIP : In general it is possible to define the area coordinates clicking the buttonIn Search area enter the coordinates of our study area:and drawing a rectangle in the map.

- UL X (Lon): 85
- UL Y (Lat): 26
- LR X (Lon): 86
- LR Y (Lat): 25
Tip: plugins such as QuickMapServices or OpenStreetMap) can be used to display a reference map and identify the study area.
- Date from: 2016-08-27
- to: 2016-08-31
Now click the button Find
 and after a few seconds the images will be listed in the
 Image list.
MODIS search
Only if preview in Layers and click the button  to download all the images listed in the
 Image list.After the download and the calculation, the bands and the water mask for every image are loaded in the map. We can apply a style to these masks to represent the value 1.
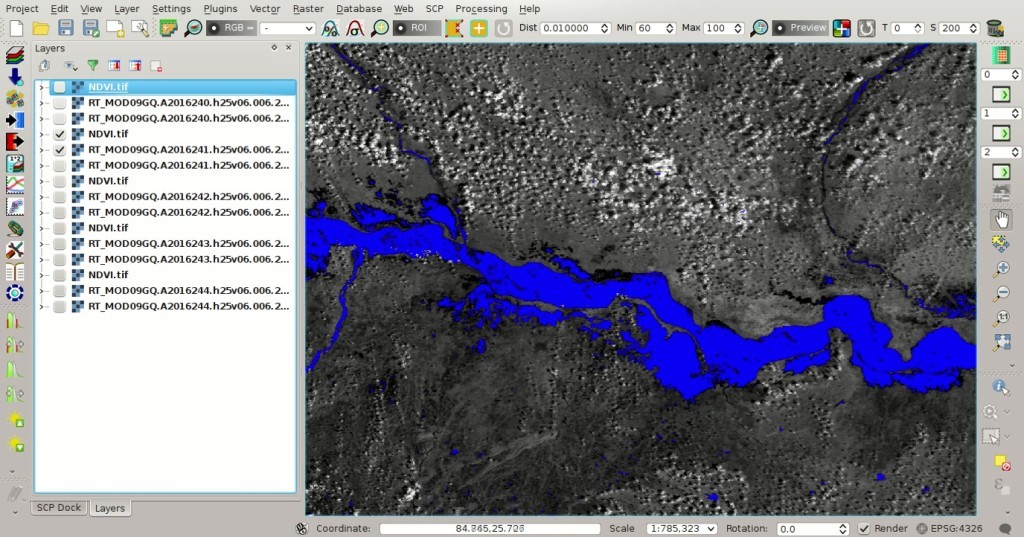
MODIS water masks
3. Water Mask Using Sentinel-2
We can repeat the download process with Landsat, Sentinel-2, and ASTER images. These images have very high spatial resolutions, allowing for the identification of water at large scale. However, the temporal resolution and the cloud cover reduce the number of available images.In this case Landsat images are very cloudy, therefore in this tutorial we are going to use a Sentinel-2. In particular, we are going to download the Sentinel-2 image
S2A_OPER_MSI_L1C_TL_SGS__20160824T101945_A006122_T44RRP acquired on 24/08/2016.In Search area enter the coordinates of our study area:
- UL X (Lon): 85
- UL Y (Lat): 26
- LR X (Lon): 86
- LR Y (Lat): 25
- Date from: 2016-08-24
- to: 2016-08-24

Search Sentinel-2 image
the images are listed in the Image list. Now click the button to download the image (in particular the zone 44RRP) and the water mask will be calculated because of the expression in Band calc (please read this tutorial Data Download for the details about selecting bands for download).
Water mask using Sentinel-2 image
To improve the identification of water, we could perform a land cover classification (for instance read Tutorial 2), or we could use the tool Edit raster to manually refine the classification removing the errors caused by clouds and cloud shadows. It is worth mentioning that SAR data such as Sentinel-1 is useful for flood monitoring.
For more tutorials and information about flood monitoring, data and tools, you can see this webminar by NASA ARSET .
For any comment or question, join the Facebook group and the Google+ Community about the Semi-Automatic Classification Plugin.